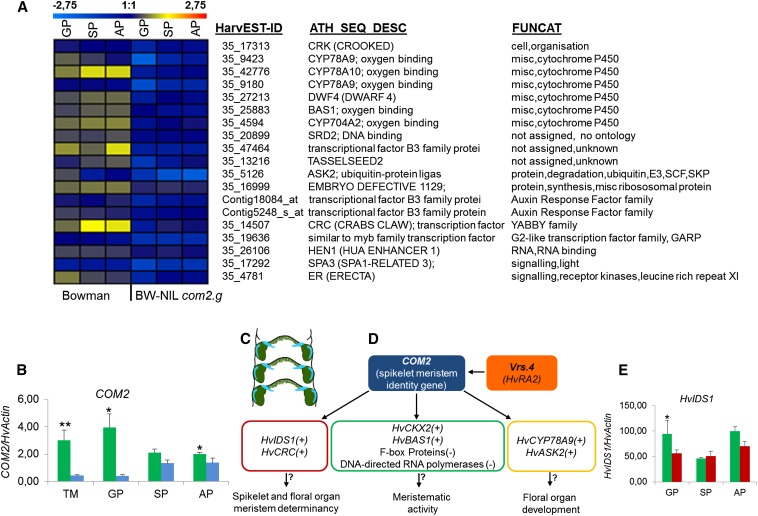
Figure 4.
Transcriptome analysis of com2.g using microarray and independent qRT-PCR, as well as model of putative COM2 interactions. (A) Heat map of genes conjointly down-regulated in the BW-NIL(com2.g) mutant as compared to corresponding wild type cv. Bowman. For up-regulated genes in the mutant, see Figure S5B. (Scale bar above heat map indicates transcript level between wild type and mutant with blue indicating down-regulation and red indicating up-regulation). (B) COM2 expression in mutant BW 903 (vrs4.k) (blue) compared to corresponding wild type cv. Bowman (green). Mean ± SE of three biological replicates. (C) Schematic drawing of central and lateral SM at the triple mound stage. Six-rowed spike 4 (Vrs4; green) and COM2 (light blue) are expressed in overlapping domains of the lateral and central spikelets. (D) Model of putative wild-type COM2 interactions. (+) and (−) indicate up- or down-regulation of the wild-type allele, respectively, in comparison to the mutant BW-NIL(com2.g). (E) HvIDS1 expression in BW-NIL(com2.g) (red) as compared to corresponding wild type cv. Bowman (green). In both B and E, the mean ± SE of three biological replicates is shown. All expression values in both B and E were log10 transformed. Asterisks show the significance level calculated by Student’s t-test, (no asterisk corresponds to P > 0.05. Single, double, and triple asterisks stand for P ≤ 0.05, P ≤ 0.01 and P ≤ 0.001, respectively). Developmental stages include: TM, triple mound; GP, glume primordium; SP, stamen primordium; and AP, awn primordium. Genes including HvIDS1, HvCKX2, and COM2 were not present on the array.

