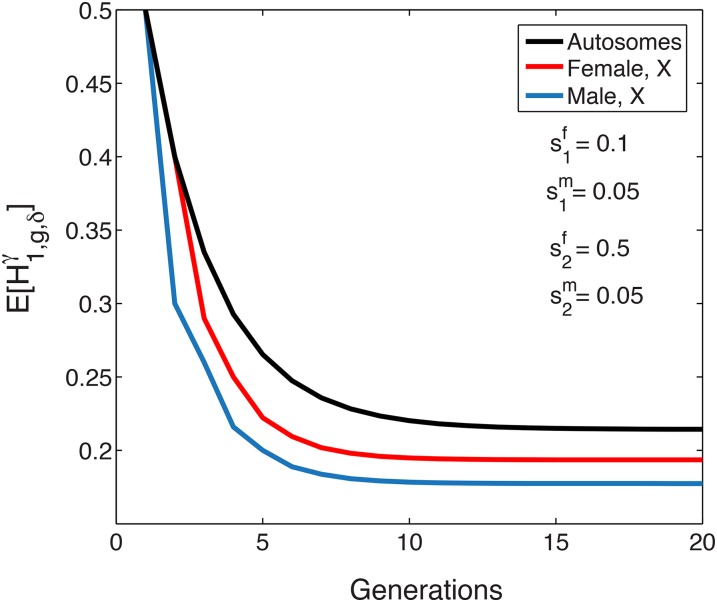
Figure 5.
The expectation of the mean X-chromosomal and autosomal admixture fractions over time for constant admixture, with female-biased contributions from both source populations. The initial condition is The mean X-chromosomal admixture from is smaller than the mean autosomal admixture, even though has an excess of females, The expectation of X-chromosomal admixture is plotted using Equations 17 and 18. The autosomal mean uses equation 37 from Goldberg et al. (2014).

