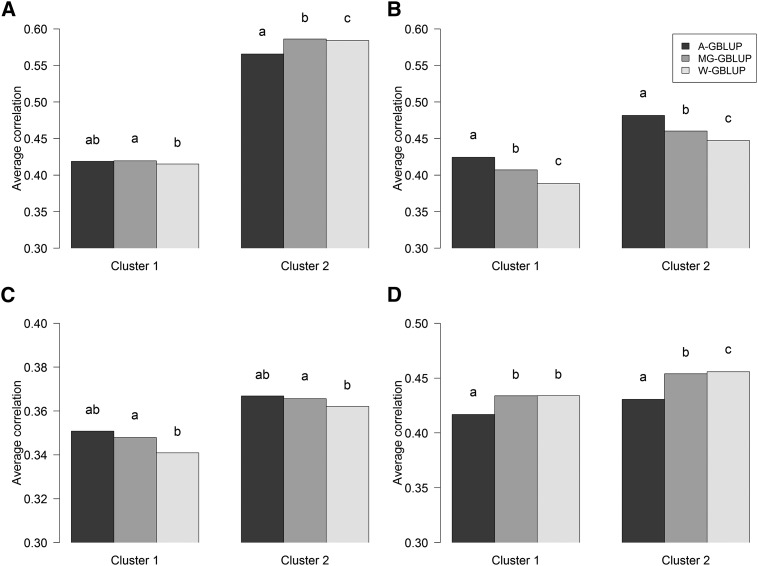
Figure 8.
Average prediction correlations in testing sets from 100 random replications of across-group GBLUP (A-GBLUP), multigroup GBLUP (MG-GBLUP), and within-group GBLUP (W-GBLUP) evaluated within each wheat cluster. Letters above bars indicate significant differences between models’ prediction correlations from paired t-tests evaluated within each subpopulation and trait, where estimates with the same letter are not significantly different (P < 0.05). (A) Environment 1. (B) Environment 2. (C) Environment 3. (D) Environment 4.

