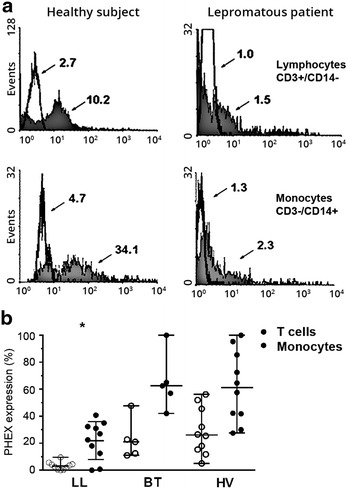
Fig. 2.

PHEX expression in T lymphocytes and monocytes by flow cytometric analysis. a Example of a flow cytometry result comparing PHEX protein expression in lymphocytes (upper) and monocytes (lower) of a healthy volunteer (left) a lepromatous patient (right). The arrows show that the fluorescence median values were lowest in the patient. b Flow cytometry analysis of peripheral blood leukocytes of LL (n = 10), BT patients (n = 5) and healthy volunteers (n = 10) showing a decrease in PHEX protein expression in LL patients (*p < 0.05)
