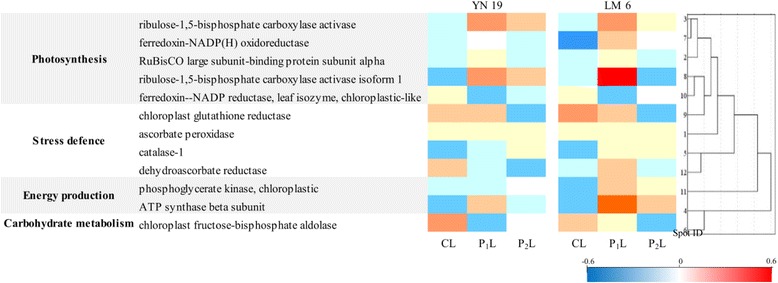
Fig. 7.

Relative expression ratio of altered proteins in wheat leaves affected by combination of mechano-stimulation and jointing cold stress. The difference of expression level at the given protein spots between CL and CC, P1L (or P2L) and CL was log-normalized and converted to a color scale. It was reorganized after analysis with the PageMan software (http://mapman.mpimp-golm.mpg.de/pageman/). Up-regulation and down- regulation were indicated in increasing red and blue, respectively. The missing proteins were indicated in white
