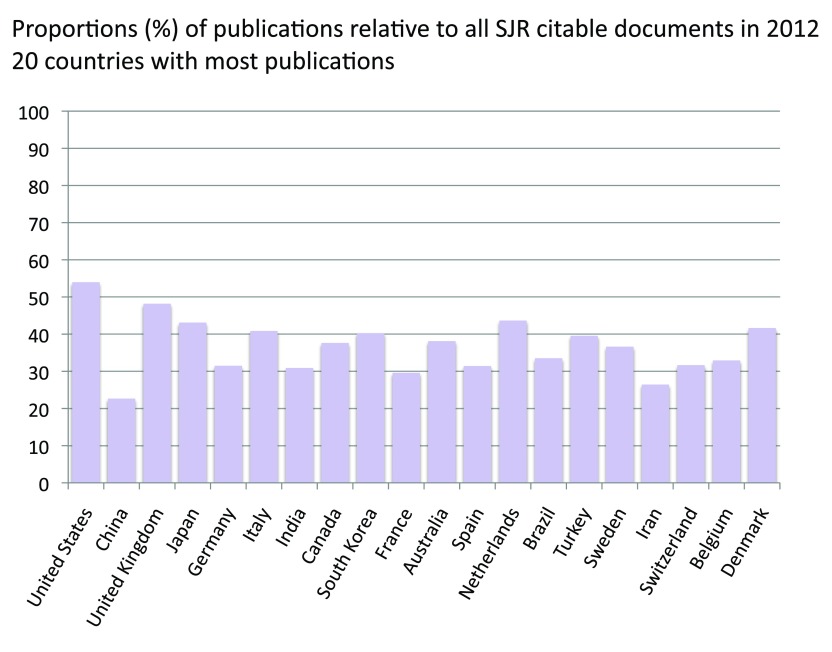
Figure S13. Proportions between the numbers of publications (reviews included) and the SJR citable documents of the 20 countries with the most publications in the year 2012.
The proportions were calculated by dividing the numbers of publications (reviews included) and all the citable documents of the SJR database (SCImago Journal & Country Rank) of the 20 countries with the most publications in the year 2012.

