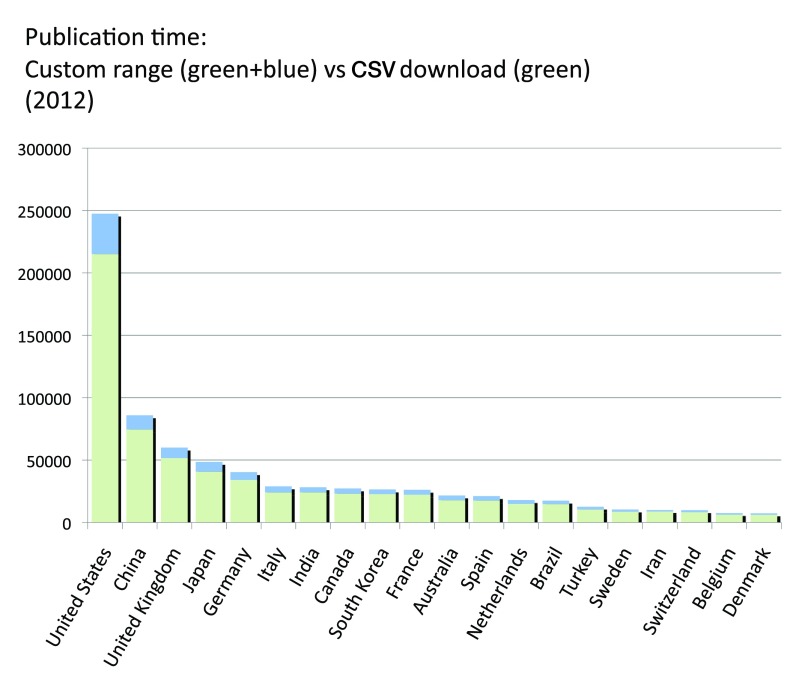
Figure S16. A comparison between automatic CSV downloads and custom range searches.
Numbers of publications (reviews excluded) of the 20 countries with the most publications (reviews excluded) in the year 2012 are shown, either obtained by automatic CSV downloads (pale green) or by custom range searches (pale green + pale blue). The pale blues portions of the bars represent the differences between the two methods.
Criteria A.

