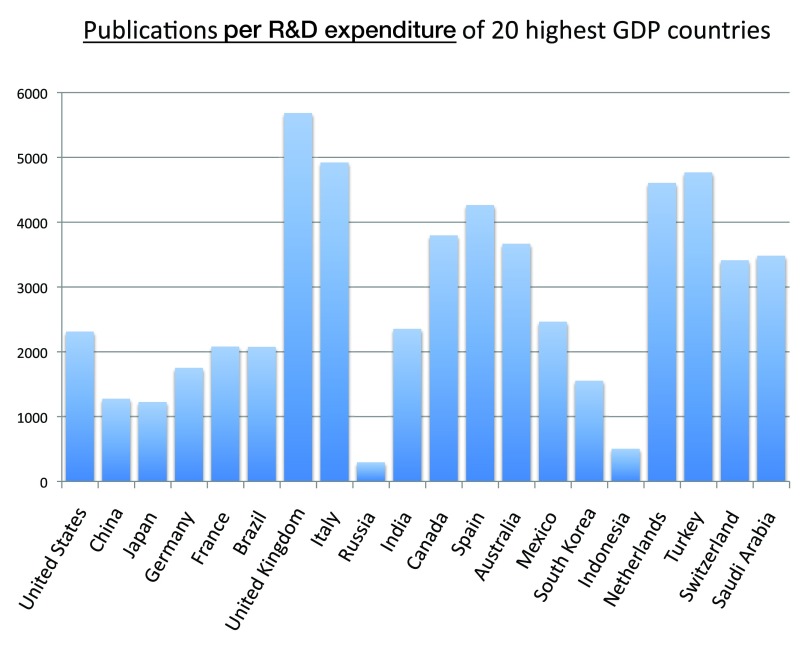
Figure 10. Publications (reviews excluded) per R&D expenditure of the 20 countries with the highest GDP in the 5-year period 2008–2012.
The numbers of publications (reviews excluded) were divided by the R&D expenditure of 2012 expressed as GERD (Gross Expenditures on Research and Development) in billion US$ at Purchasing Power Parity (PPP). The data of R&D expenditures of countries were taken from the Battelle nonprofit private company ( http://www.battelle.org/docs/tpp/2014_global_rd_funding_forecast.pdf).
Criteria A.

