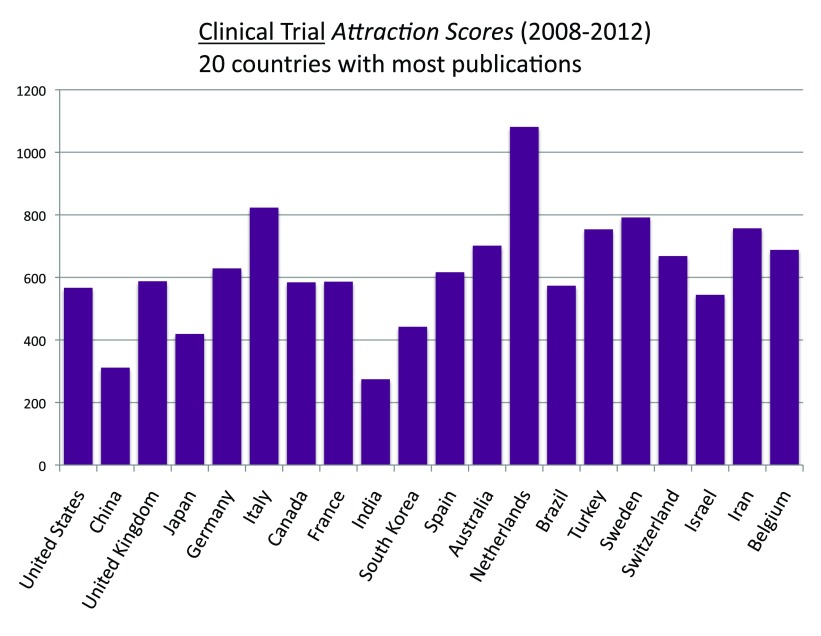
Figure 15. “Clinical Trial Attraction Scores” for the 20 countries with the most publications (reviews excluded) in the 5-year period 2008–2012.
The “Clinical Trial Attraction Scores” were calculated by dividing the numbers of Clinical Trials publications (reviews excluded) by the total numbers of publications (reviews excluded) in the 5-year period 2008–2012 and multiplying by 10,000.
Criteria A and E.

