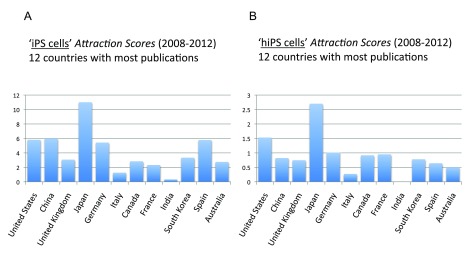
Figure 19. “iPS cells Attraction Scores” and “hiPS cells Attraction Scores” for the 12 countries with the most publications (reviews excluded) in the 5-year period 2008–2012.
( A) The “Topic Attraction Scores” were calculated by dividing the numbers of publications (reviews excluded) with “induced pluripotent stem cells” in the title/abstract field by the total numbers of publications (reviews excluded) in the 5-year period 2008–2012 and multiplying by 10,000. ( B) The “Topic Attraction Scores” were calculated by dividing the numbers of publications (reviews excluded) with “human induced pluripotent stem cells” in the title/abstract field by the total numbers of publications (reviews excluded) in the 5-years period 2008–2012 and multiplying by 10,000.
Criteria B.

