
Fig. 6.
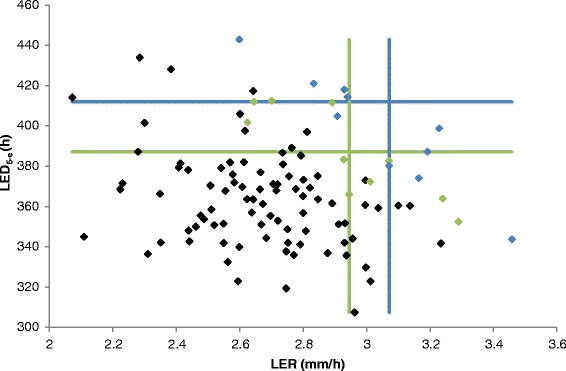
Scatter plot of the measurements for the leaf elongation rate (LER) and leaf elongation duration (LED5-e) traits. Blue dots indicate the 10 % of RILs with the largest leaf length; green dots the 20 % of RILs with largest leaf length. Blue lines represent the borders of the 10 % of RILs with largest LED5-e and LER; green lines represent the borders of the 20 % of RILs with largest LED5-e and LER