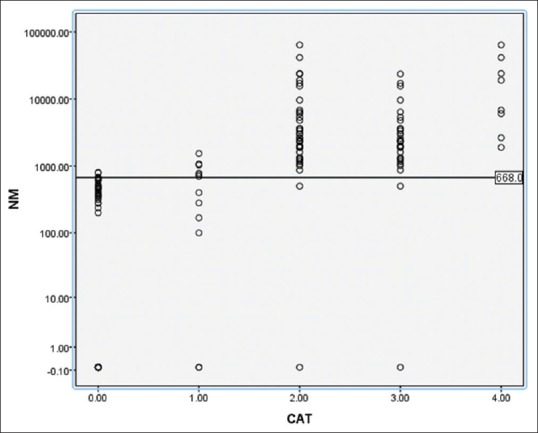
Figure 2.

Comparison of normetanephrine values in different groups using scatter plot Groups (0-control, 1-head and neck paragangliomas, 2-pheochromocytomas and paragangliomas [PHEO/PGL], 3-benign PHEO/PGL, 4-malignant pheochromocytomas/paragangliomas). In this scatter plot the normetanephrine levels were compared between different groups
