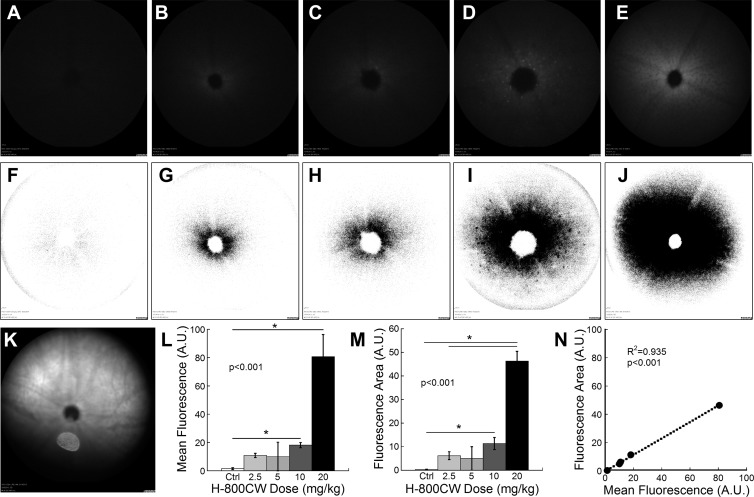
Figure 3.
Representative fundus images of 129/SvJ mice after LIRD showing the dose–response curve for intravenous H-800CW. Hyperfluorescence of oxidized H-800CW is shown in the fundus using SLO (A–E) or as fundus images with converted colors to show the area of hyperfluorescence (F–J). CTRL (A, F) or LIRD animals received a dose of 2.5 (n = 7; [B, G]), 5 (n = 4; [C, H]), 10 (n = 7; [D, I]), or 20 mg/kg (n = 5; [E, J]) H-800CW. All CTRL mice receiving any H-800CW dose and LIRD mice receiving vehicle appeared the same as shown in (A). Mean fluorescent intensity was significantly greater with 10 or 20 mg/kg doses ([L] Kruskal-Wallis 1-way ANOVA on ranks, H = 23.4, P < 0.001). The total area of positive fluorescence was significantly greater in mice receiving the two highest doses ([M] Kruskal-Wallis 1-way ANOVA on ranks, H = 23.6, P < 0.001). A representative IR fundus image (K) showing the plane of focus for the ICG fluorescent images shown in (A–E). Oxidized H-800CW fluorescence was located distal to the retinal vasculature. The two methods of fluorescent quantification show highly correlated measurements (N). Post hoc comparisons *P < 0.05.

