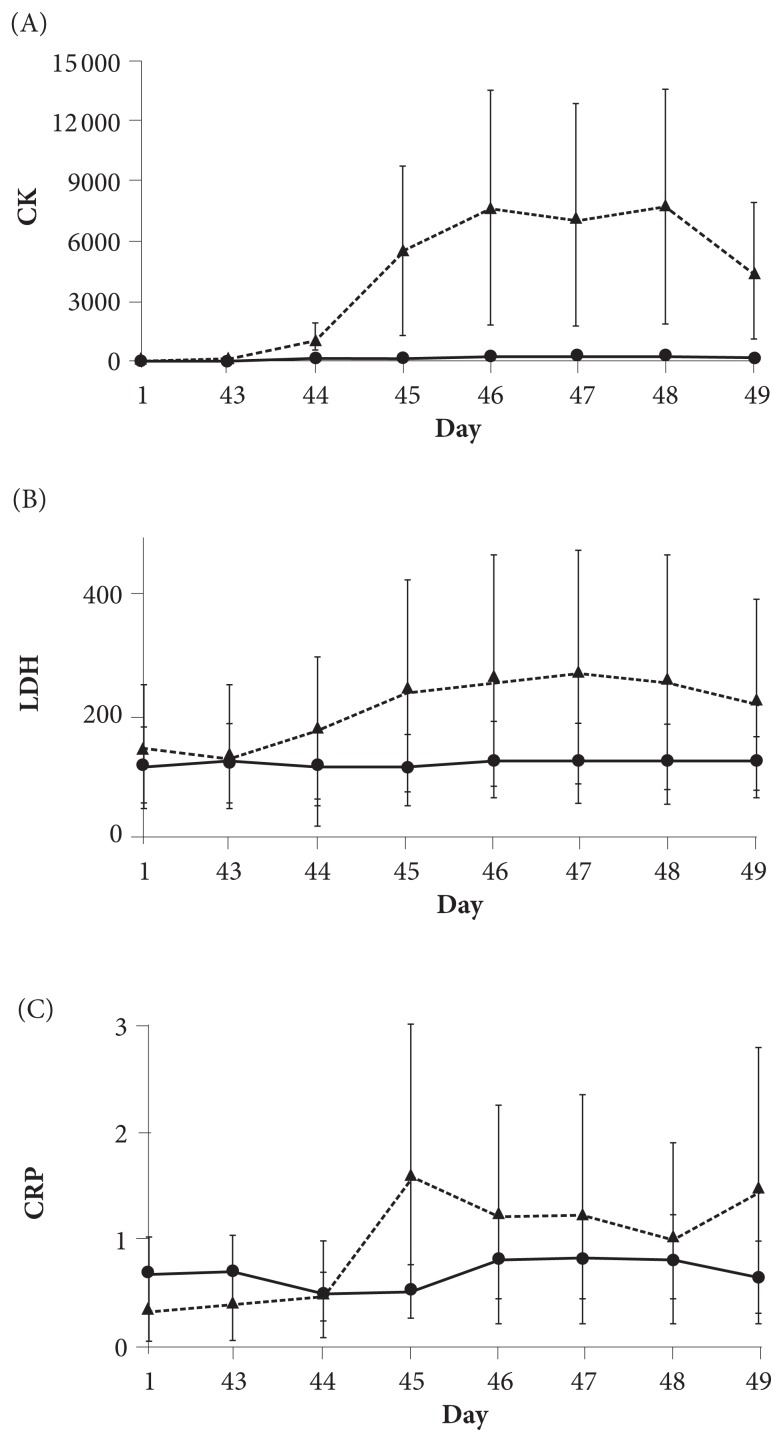
Figure 1.
Concentrations of biomarkers for muscle tissue damage post-UBC. Figure 1A shows CK; Figure 1B shows LDH; and Figure 1C shows CRP. A solid line represents a change in the plasma concentration of each biomarker in the intervention group, whereas a dotted line represents a change for the placebo group. All values are mean ± SD.
Abbreviations: UBC, upper-body, muscle-damaging, resistance exercise; CK, creatine kinase; LDH, lactate dehydrogenase; CRP, C-reactive protein; SD, standard deviation.

