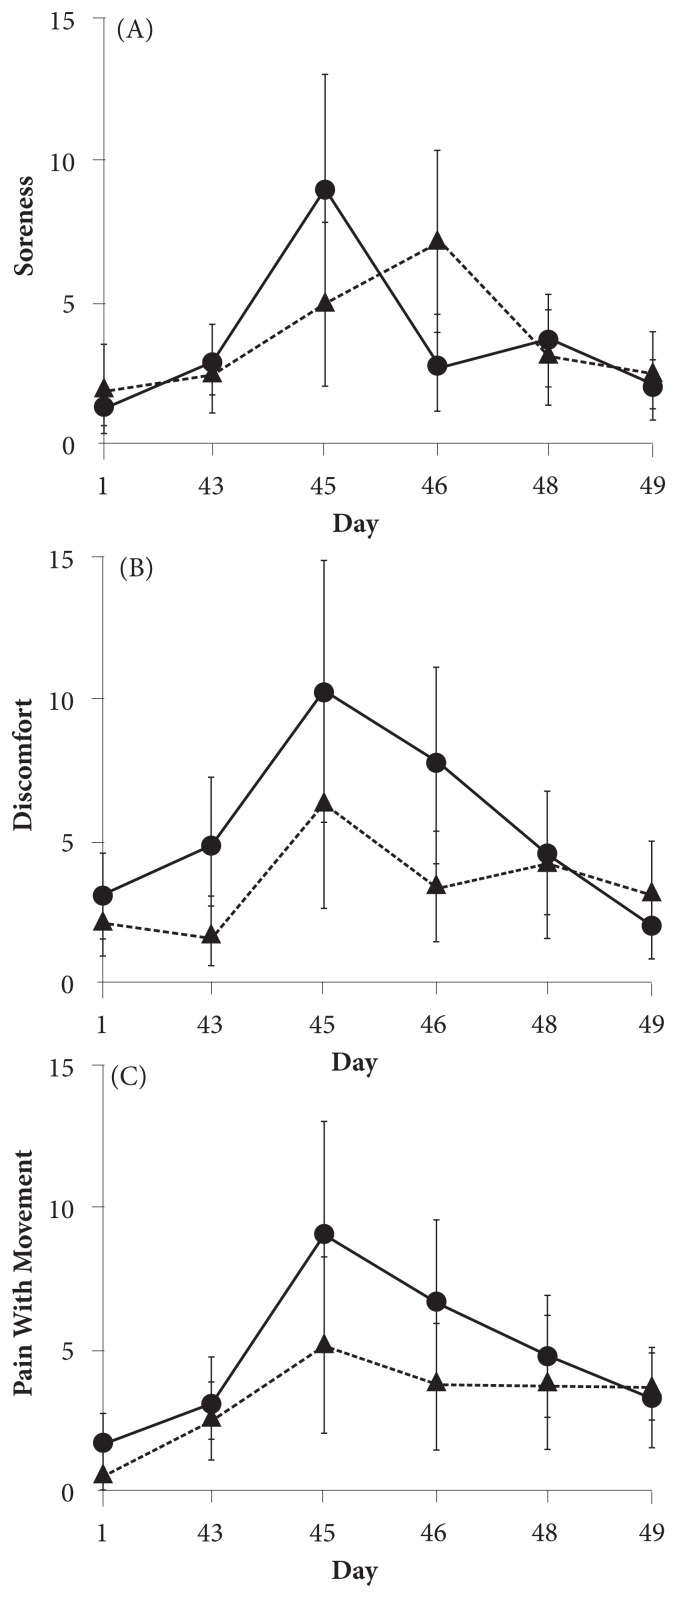
Figure 4.
VAS scores for DOMS. Figure 4A shows soreness, 4B shows discomfort, and 4C shows pain with movement. The solid line represents the change in DOMS in the intervention group, whereas the dotted line represents the change in the placebo group. All values are mean ± SD.
Abbreviations: VAS, visual analog scale; DOMS, delayed-onset muscle soreness; SD, standard deviation.

