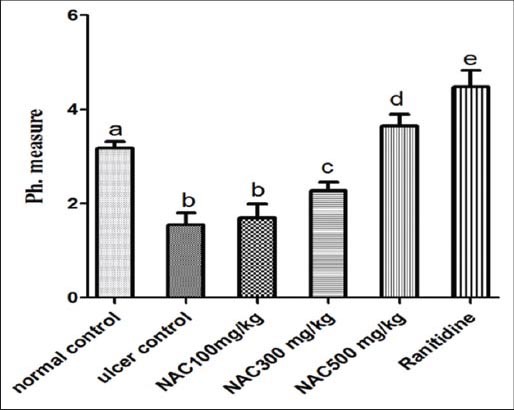
Figure 5.

pH values in mice with acute gastric ulcer induced by absolute ethanol (n = 7), ANOVA: values with different letters a, b, c, d and e, P < 0.05 versus normal control, ulcer control, N-acetylcysteine (NAC) 100 mg/kg, NAC300 mg/kg and NAC500 mg/kg respectively
