Fig. 3.

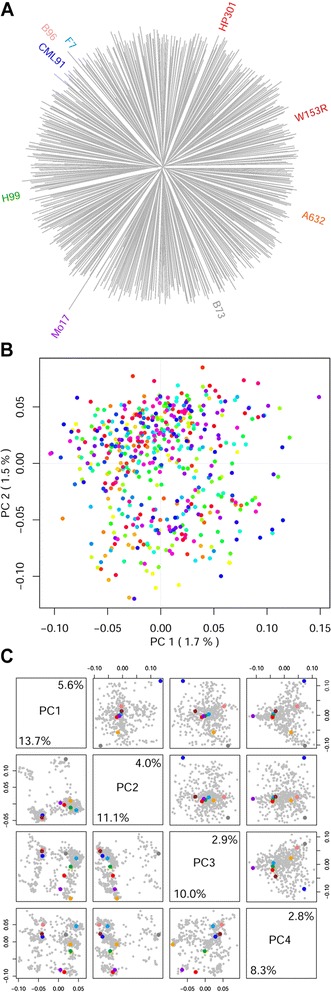
Diversity in the MM population. Panel a depicts a NJ phylogeny of the MM lines, with MM founder labels depicted radially. The long terminal branches and deep common ancestors show that MM lines are genetically diverse and unique to each other. Founder lines are also evenly distributed, except for Mo17, whose diversity is overestimated by the genotypic array design. Panel b shows a principal component (PC) analysis of the full set of SNPs. Different colors represent different subfamilies. The low PC loadings, reported on axes, confirm no structure in the dataset. In panel c the first four PC (PC 1–4) from a subset of centromeric (bottom left) and telomeric SNPs (top right) are shown. The relative PC loadings are shown along the diagonal, with values cornering either telomeric or centromeric regions. MM founders are color coded according to Fig. 3a. Pericentromeric regions still present a structure that is lost in the telomeric regions of the MM lines, as confirmed by higher PC loadings
