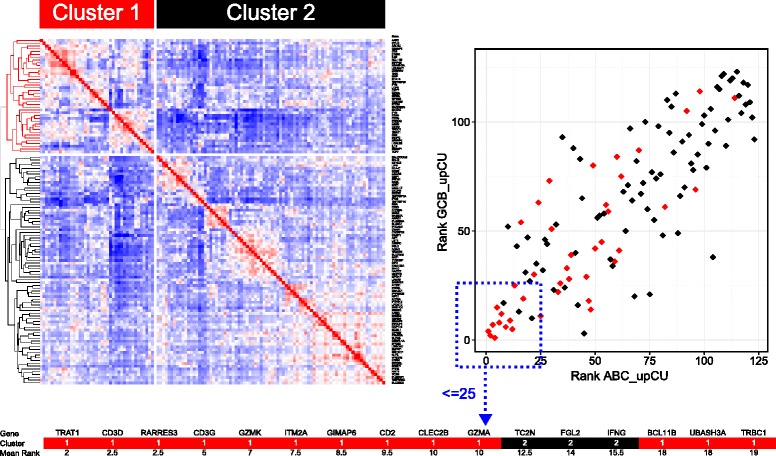
Fig. 4.

Genes most consistently associated with COO-unclassified DLBCL are related to a polarized immune response. The two principal branches of the gene-centred hierarchical clustering tree of the COO-unclassified meta-profile are illustrated on the left. Colour-coding identifies: red cluster 1, corresponding to the T-cell cluster; black cluster 2, IFN and monocyte/immune NOS (not otherwise specified). On the right the relative rank of differentially expressed genes contributing to the COO-unclassified meta-profile is plotted using a differential expression ranking, derived from the number of data sets with differential expression to the power of normalized median fold change; the x-axis indicates differential expression rank in the comparison COO-unclassified versus ABC-DLBCL; the y-axis indicates differential expression rank in the comparison COO-unclassified versus GCB-DLBCL. Cluster membership is superimposed on the scatter plot of differential expression rank according to the colour coding shown (red cluster 1, black cluster 2). The 16 genes most consistently separating COO-unclassified DLBCL from either ABC- or GCB-DLBCL are illustrated below with cluster membership and mean differential expression rank shown. See corresponding Additional file 11
