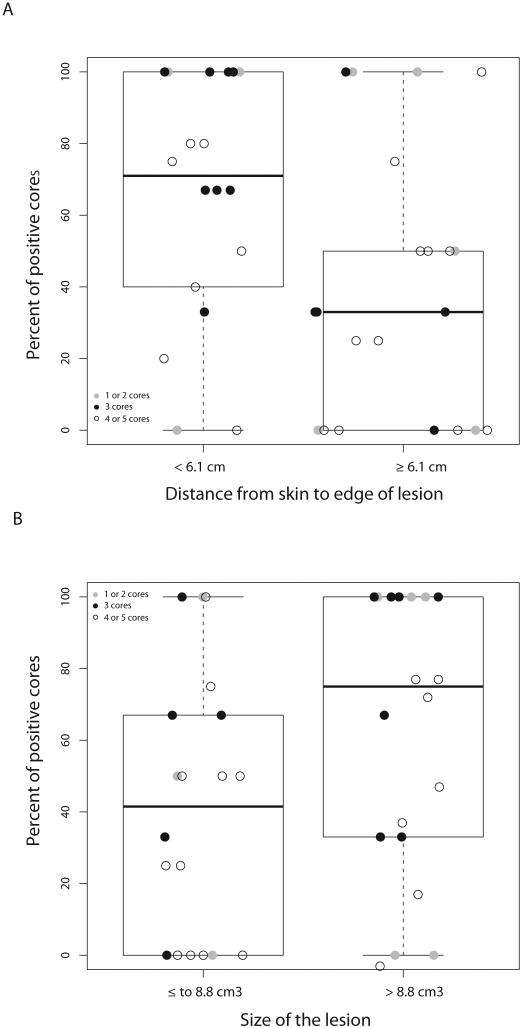
Figure 2.
A. Percent positive cores (PPC) by lesion size. B. PPC by distance from the skin to the lesion edge. The box signifies the upper and lower quartiles, and the median is represented by the solid black line within the box. Outliers, defined as values above or below 1.5 × upper and lower quartiles, are represented by the dashed lines extending vertically.

