
Figure 1.
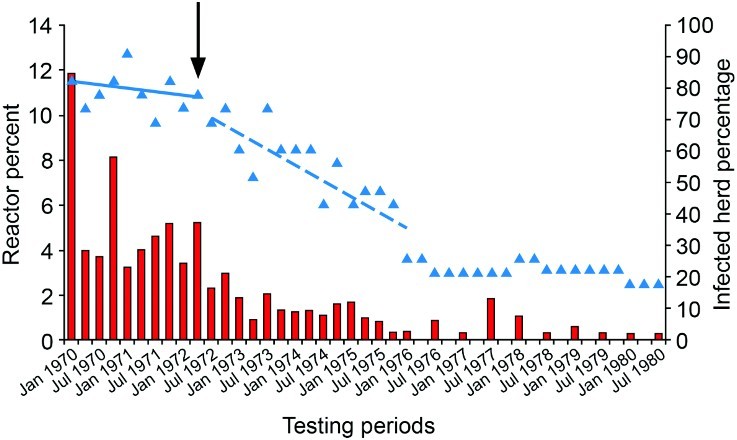
Percentage of total cattle tested for tuberculosis (TB) that were test-positive and sent for slaughter (red bars) and percentage of herds (n=24) that were infected with TB (blue triangles) in the Buller South area (mean combined cattle population 4,474) of the West Coast region of New Zealand, from 1970–1980. Blue lines represent linear trends in percentage infected herds before (solid line) and after (dashed line) commencement of intensive possum control in autumn 1972 (black arrow). (J. Edington2, pers. comm.).