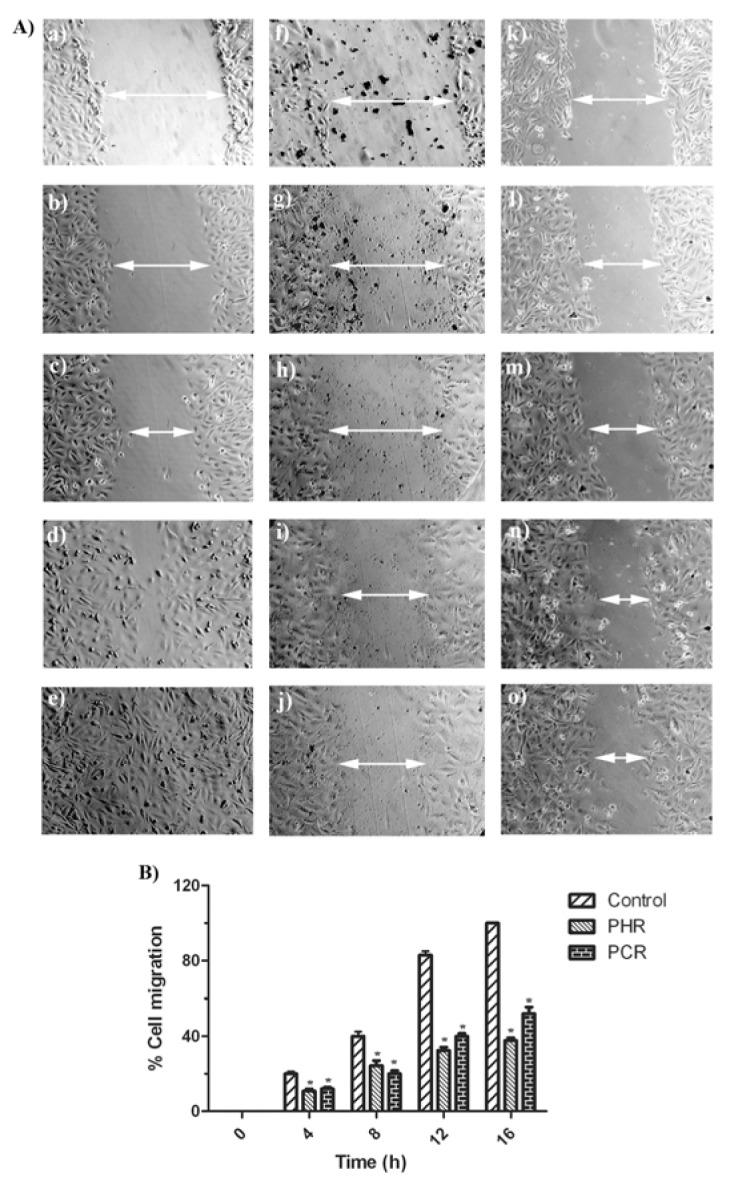
Figure 6. (A) Observation of MDA-MB-231 cells migration, from edges of the scratch wound after 0, 4, 8, 12 and 16 h in control well (a, b, c, d, e), PHR treated well (f, g, h, i, j) and PCR treated well (k, l, m, n, o) respectively (n = 3). (B) Calculated % cell migration of MDA-MB-231 cells, portraying decreased migration in PHR and PCR treated cells compared to control cells. Data presented as mean ± SD (n = 3). Asterisk (*) indicates significant (P < 0.05) difference from the respective control groups.

