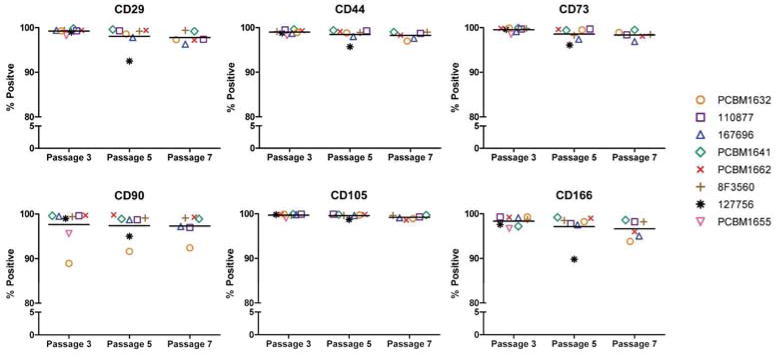
Figure 2. MSCs maintain expression of cell surface markers through passages.

MSCs were stained for CD29, CD44, CD73, CD90, CD105 and CD166 at P3, P5 and P7. Gating was applied to unstained controls at each passage for each donor, and the percent positive was reported. Data is grouped by passage number, and horizontal bars indicate the average percent positive expression of all (applicable) cell lines at that passage. Each donor is represented as a unique symbol and color, as seen in the figure legend.
