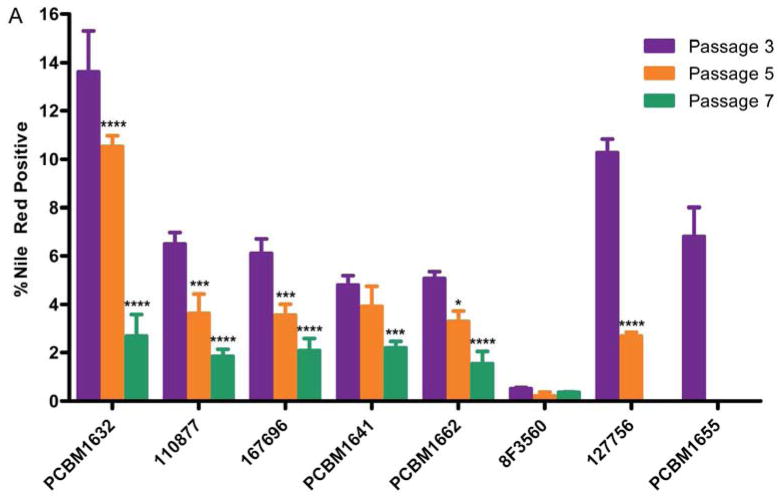
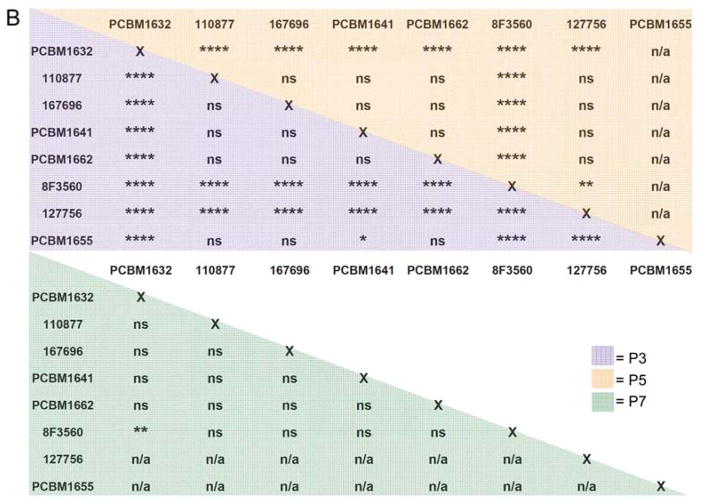
Figure 7. Adipogenesis can be quantified by automated microscopy, and demonstrates both donor variability and decreased adipogenic potential with increasing passage.
(A) Nuclei plus Nile Red objects were normalized by the total nuclei count per image to report a percentage of differentiated cells (% Nile Red positive) as a function of passage and cell line. Purple bar = P3; orange bar = P5; green bar = P7. Error bars represent standard deviation; n=3. Statistical comparisons were made within cell lines, relative to P3. (B) Statistical analysis of percent adipogenesis data for comparison between cell lines. Purple shading = P3, orange shading = P5, green shading = P7. For (A) and (B), ****p<0.0001, ***p<0.001, **p<0.01, *p<0.05, ns = not significant, n/a = not applicable.


