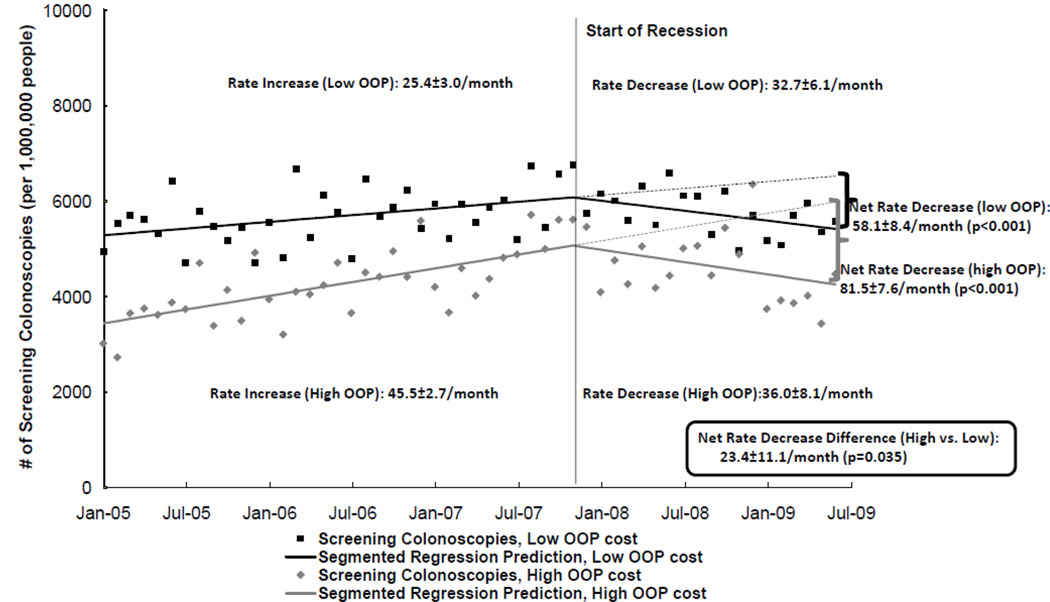
Figure 2. Screening Colonoscopy Utilization Among Insurance Beneficiaries of Plans with High (≥$300) and Low (≤$50) Out-of-pocket (OOP) Costs Before and During the Recession.
Black boxes represent rates of screening colonoscopy each month and solid black line represents screening colonoscopy rates predicted by segmented regression models before and during the economic recession among members of plans with low OOP costs. Gray diamonds represent rates of screening colonoscopy each month and solid gray line represents screening colonoscopy rates predicted by segmented regression models before and during the economic recession among members of plans with high OOP costs. Broken line represents recession era rates that would have been expected based on projections of pre-recession trends. Net decrease represents the difference between these recession-era predicted rates and observed rates. P-value for test of trend change from pre-recession to recession period between plans with high OOP costs and low OOP costs. Numerical data displayed in Appendix 2, Table 2. Data source: LifeLink™ Health Plan Claims Database (January, 2005 through June, 2009)

