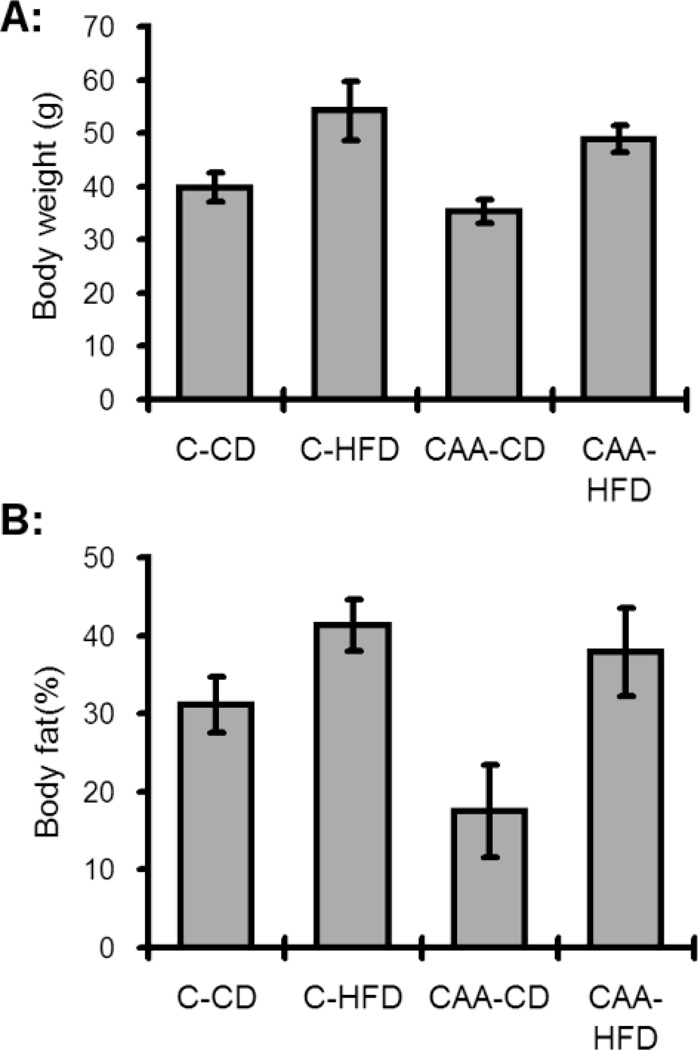
Fig. 1. Body weights and body fat following diet induced obesity.
(A) Control HFD mice (C-HFD) were significantly heavier than all other groups (p<0.05) while CAA control diet (CAA-CD) mice weighed significantly less than all other groups (p<0.05). (B) Body fat as measured by NMR revealed increased total body fat (p<0.05) for both groups fed the HFD. The CAA-CD mice had less fat compared to all other groups (p<0.05).

