
Figure 2.
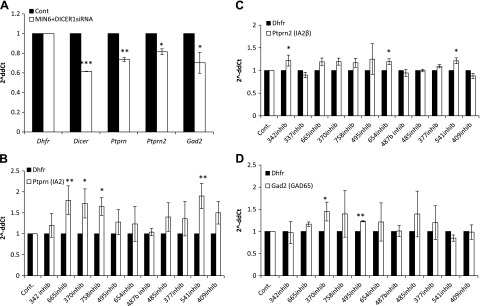
Endogenous target expression after transfection with Dicer siRNA and with the different miRNA inhibitors in MIN6 cells. qReal-time PCR analysis of expression. A) Transient transfection with siRNA for Dicer1, relative to transfection with a negative scrambled sequence and mock transfection. *P < 0.05, **P < 0.002, P < 1.3e-05. B) Ptprn expression levels after transfection with miRNA inhibitors for 72 h. *P < 0.03, **P < 0.002. C) Ptprn2 expression levels after transfection with miRNA inhibitors for 72 h. *P < 0.04. D) Gad2 expression levels after transfection with miRNA inhibitors for 72 h. *P < 0.04, **P < 0.002. Fold change is presented as 2−ΔΔCt relative to a transfection control samples and normalized to Dhfr or β-actin. Vertical lines represent sd. All experiments were repeated at least 3 times.