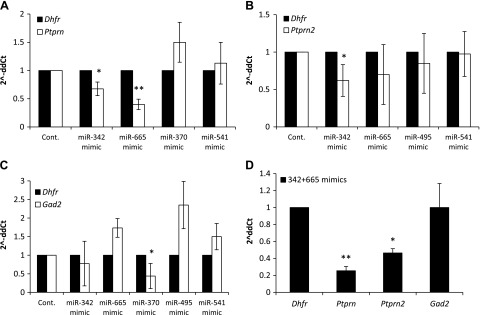
Figure 3.

Endogenous target levels after overexpressing different miRNAs in MIN6 cells by using mimic transfections. A) Ptprn expression levels 72 h after transfection with miRNA mimics. *P < 0.05, **P < 0.01. B) Ptprn2 expression levels 72 h after transfection with miRNA mimics. *P < 0.04. C) Gad2 expression levels 72 h after transfection with miRNA mimics. *P < 0.05. D) mRNA expression level of all 3 autoantigens 72 h after transfection with a combination of miR-342 and -665 mimics. *P < 0.004, **P < 0.002. Analyses were performed by qReal-time PCR. Fold change is presented as 2−ΔΔCt relative to a transfection control samples and normalized to Dhfr or β-actin. Vertical lines represent sd. All experiments were repeated at least 3 times.
