Figure 6.
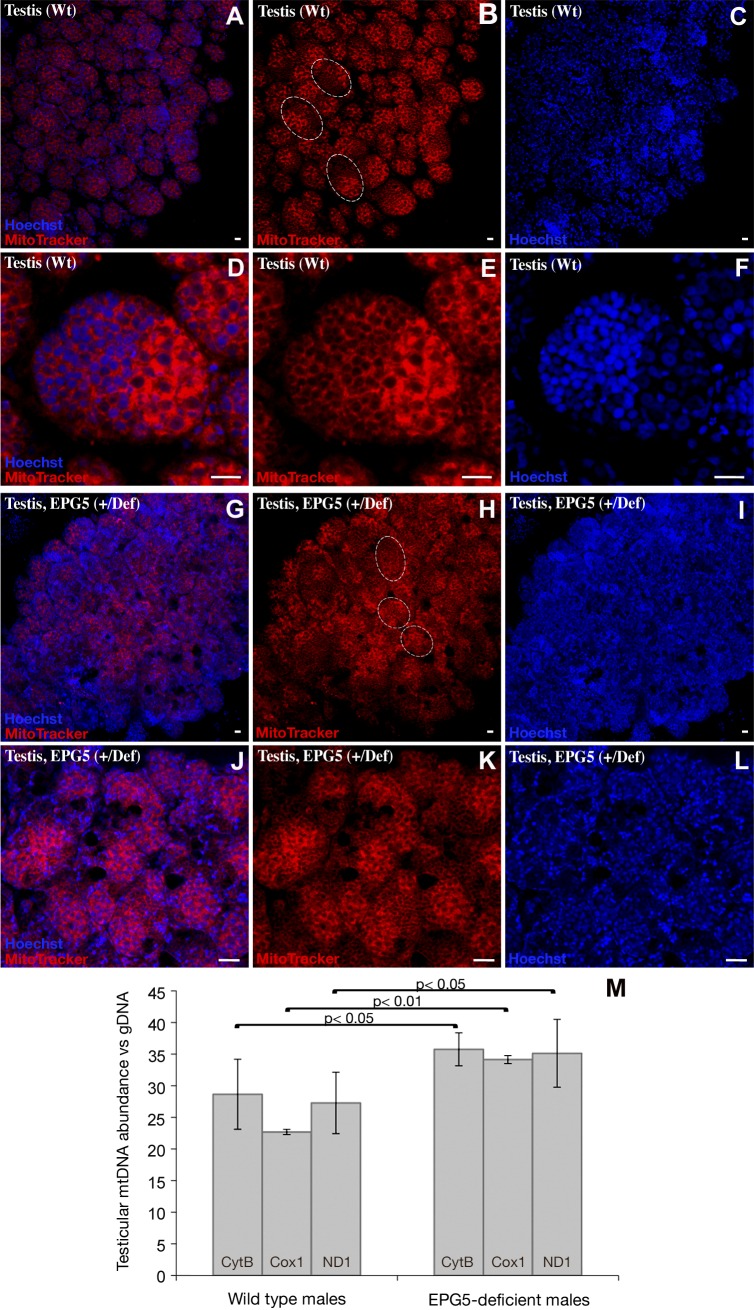
Increase of mitochondria in Ol-epg5-deficient testes. A–L) In addition to an obvious disorganized structure (see also Fig. 3E, G), (G–L) Ol-epg5-deficient testes stained with MitoTracker (Life Technologies-Molecular Probes) showed an increase in mitochondria compared with wild type (A–F). M) Real-time PCR quantification of mitochondrial DNA revealed a significantly higher DNA content in Ol-epg5-deficient testes than in wild types. Dotted lines: cysts in the testis. Scale bars, 5 µm.

