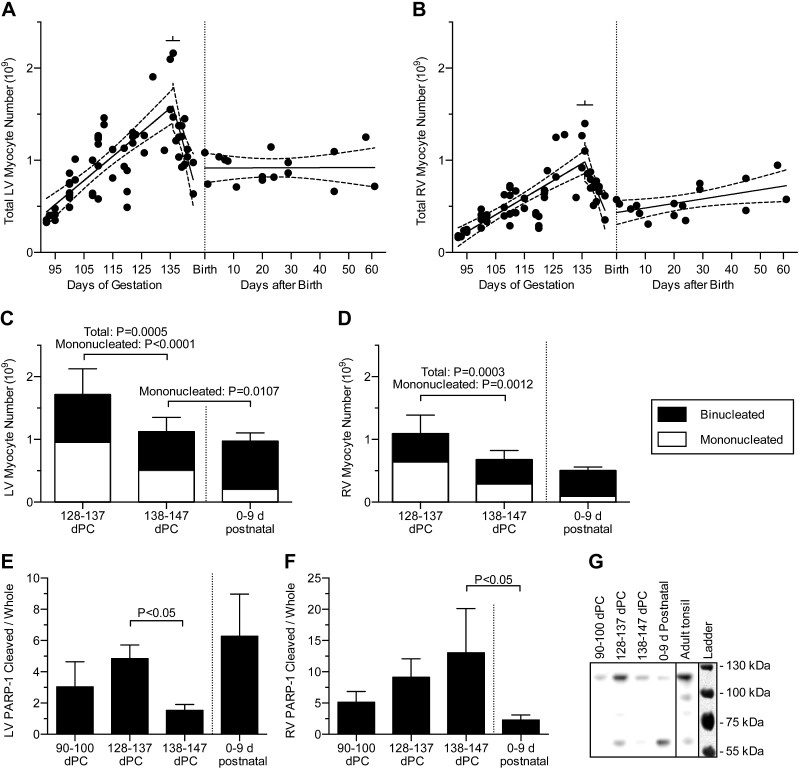
Figure 6.
LV (A) and RV (B) total free wall myocyte numbers in the fetus and neonate. Bisegmental linear regressions were fitted to the previously published fetal data (n = 63 fetuses) from Jonker et al. (3). Separately, linear regressions were fitted to the neonatal data (n = 16 neonates). An increase in RV but not the LV cell number was found during the neonatal period (P = 0.028). Regression lines (solid) and 95% CI (dashed; best fit to each data set) are shown; bars show 95% CI of the breakpoints. Regression data are included in Tables 1 and 2. LV (C) and RV (D) myocyte numbers were compared at 10 d intervals before term and after birth. Comparison of adjacent ages (mean 134 ± 1 dPC, n = 6; 140 ± 1 dPC, n = 13; 4 ± 2 d postnatal, n = 5) determined that total myocyte number decreased immediately prior to birth (by 34% in the LV and 38% in the RV), but not at birth. sd of total number is shown. Quadrinucleate myocytes contribute less than the thickness of the line to any group. E) LV and (F) RV abundance of cleaved to whole PARP-1 was compared in early gestation and at 10 d intervals before term and after birth (mean 94 ± 1 dPC, n = 6; 133 ± 3 dPC, n = 7; 139 ± 2 dPC, n = 7; 4 ± 3 d postnatal, n = 7). Error bars show standard error of the mean. G) A representative PARP-1 Western blot. Blot image is inverted. Ladder overlay is contrast-enhanced white light image.

