
Figure 4.
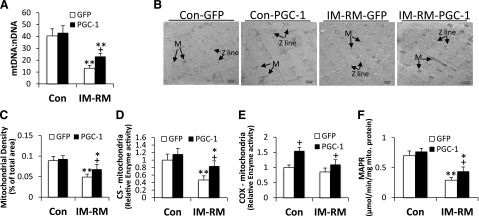
PGC-1α overexpression reversed mitochondrial dysfunction caused by IM-RM. Conditions of IM-RM and Con are described in Fig. 2. A) Quantifications of mtDNA by analyzing of the difference in threshold amplification between mtDNA and nuclear DNA using quantitative RT-PCR (ΔΔCt method; n = 7). B) Representative transmission electronic microscopy images of mitochondria in TA muscle. M, mitochondria; scale bars, 1 µm. C) Mitochondrial density analysis. (n = 5). D) Mitochondrial CS activity (n = 7). E) Mitochondrial cytochrome c oxidase (COX) activity (n = 7). F) Mitochondrial ATP production rate (MAPR) (n = 10). Values are the means ± sem. *P < 0.05 vs. Con; **P < 0.01 vs. Con; +P < 0.05 PGC-1α vs. GFP; 2-way ANOVA with Tukey-Kramer’s post hoc test.