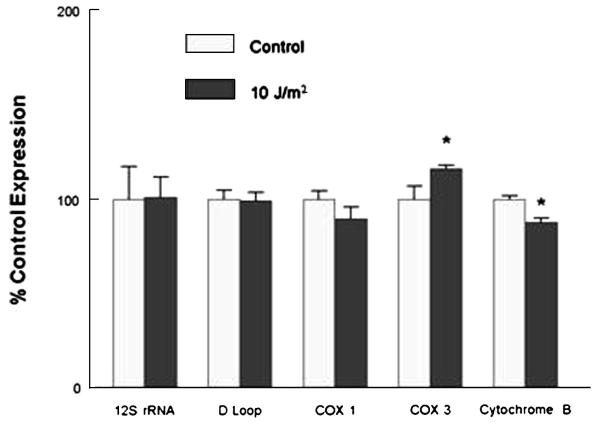
Figure 7.
Regional copy number test. H9c2 DNA (control and 10 J/m2 UV light) were amplified and copy number normalized using β-actin. Three of the regions found no differences, while the cytochrome oxidase subunit 3 region was significantly increased by 16% and the cytochrome B region decreased by 12%. Values are mean±SEM expression expressed as a percentage of control; * p<.05 compared to respective control.

