
Figure 1.
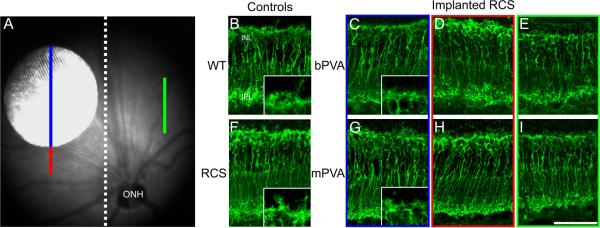
A) Sample fundus image of an RCS rat eye implanted subretinally with an mPVA. White dotted line indicates location of the cut made in the superior to inferior plane bisecting the posterior eye cup into implanted and non-implanted halves. “Implanted” region is indicated by the blue line. The area immediately “adjacent” to the implant site is shown by the red line. The green line displays an area opposite the implant within the non-implanted half, referred to as a “distal” area. The implant is 1mm in diameter. PKCα labeling in retinal cross-sections from WT rats (B), unimplanted control RCS rats at 2 months of age (F), RCS rats implanted from 4 to 8 weeks postnatal with a bPVA (C-E) and or mPVA (G-I). Rod bipolar cells are present with well-preserved morphology and localization at the implant site (C and G) relative to adjacent (D and H) and distal (E and I) regions. Implanted eyes show PKCα labeling consistent with that of age-matched unimplanted RCS controls (F). Wild-type retinas (B) appear to exhibit more intact dendritic tufts, but somata and axon terminal localization is comparable to that in RCS tissue. Insets 1B, 1C, 1 F & 1G show magnified images of the dendritic tufts in the OPL. ONL=outer nuclear layer, OPL=outer plexiform layer, INL=inner nuclear layer, IPL=inner plexiform layer, GCL=ganglion cell layer. Scale bar=50μm.