Fig. 1.
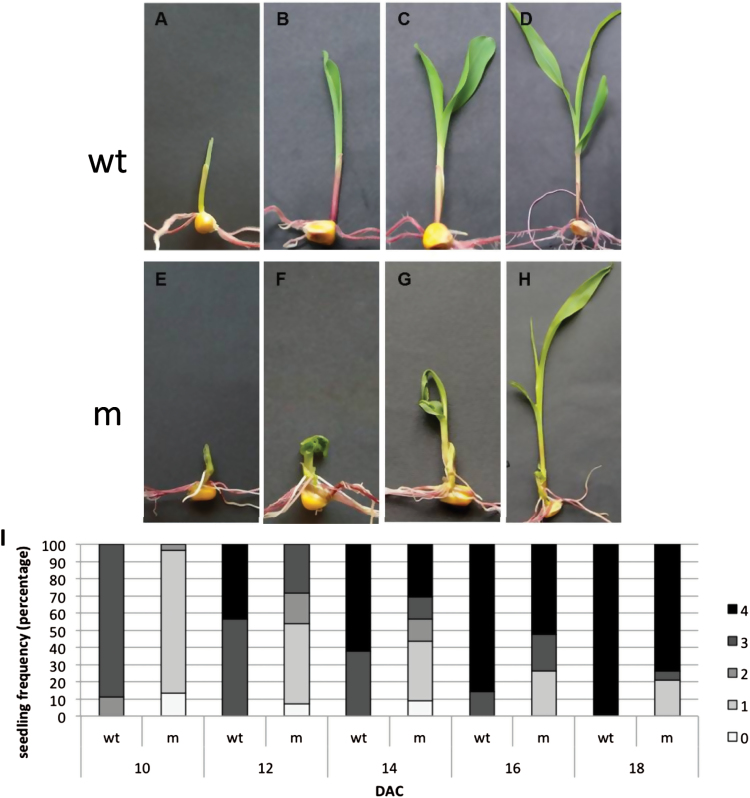
Seedling phenotypes and developmental profile of fdl1-1. Representative wild-type (A–D) and mutant (E–H) seedlings were photographed at successive stages of development: coleoptile (A, E), first leaf (B, F), second leaf (C, G) and third leaf (D, H). The developmental profile of fdl1-1 mutant (m) and wild-type (wt) seedlings is presented as percentage of seedlings in each stage at a specific time after initiation of cultures (I). Between 30 and 40 seedlings were analysed for each time point. 0, coleoptile presence; 1, first leaf presence; 2, second leaf presence, 3, third leaf presence; 4, fourth leaf presence; DAC, days after initiation of cultures.

