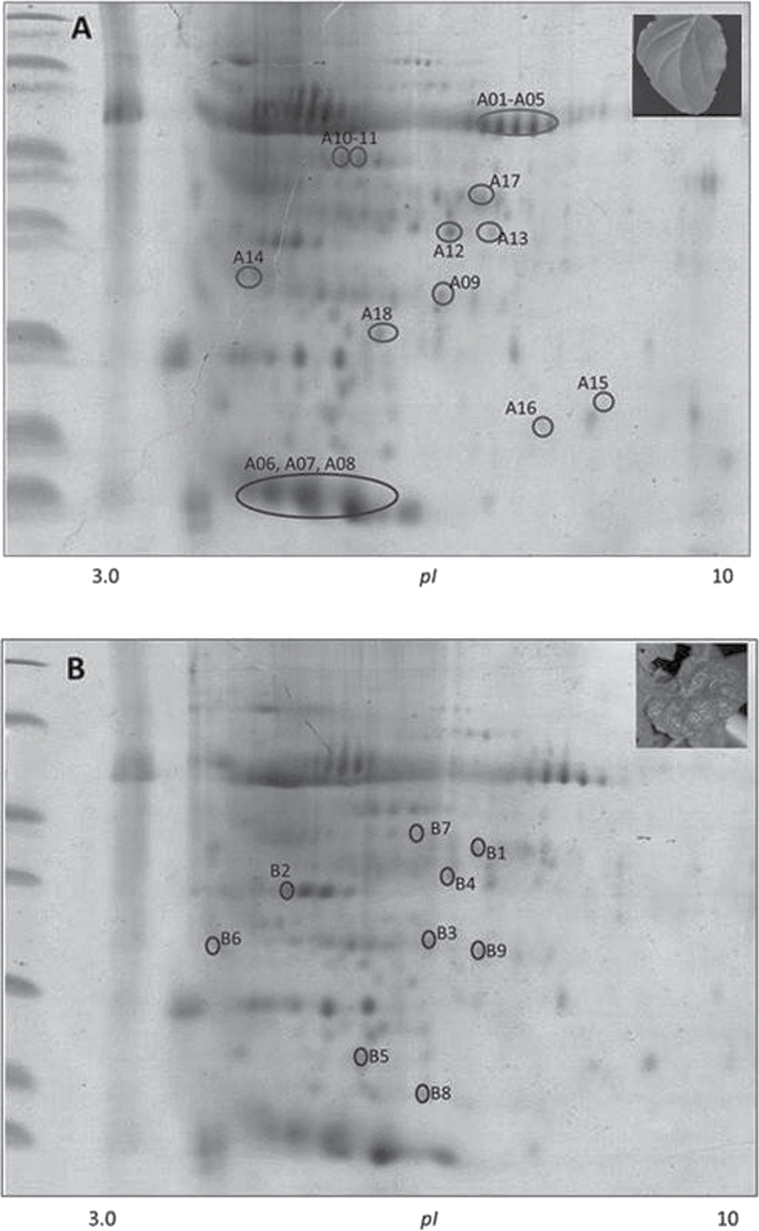
Fig. 10.
Changes in the proteome profile of N. benthamiana leaves after betasatellite infection. Two-dimensional gel electrophoresis of total protein extracted from plant leaves infected with (A) A and (B) A+β. The circles indicate the positions of proteins whose expression levels were altered by betasatellite infection. The spots on gel A and gel B were down-regulated and up-regulated, respectively. Changes in protein spots were calculated with ImageMaster 2D Platinum v6.0 software.

