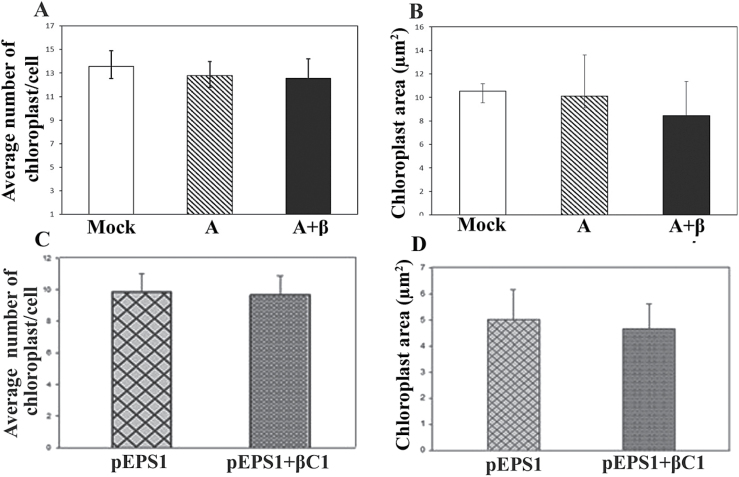
Fig. 5.
Effect of RaLCB infection on chloroplast number and area. Comparison of chloroplast area in symptomatic leaves of (A) mock-, A-, and A+β-inoculated plants at 28 dpi. (C) pEPS1 vector- and pEPS1-βC1-infiltrated plant at 8 dpi. Comparison of number of chloroplasts in symptomatic leaves of (B) mock-, A-, and A+β-inoculated plants at 28 dpi (D) pEPS1 vector- and pEPS1-βC1-infiltrated plant at 8 dpi. Bars represent means ±standard errors for at least 20 replicates per treatment. Grand means of data were calculated from replicates of infected samples and the means obtained were subjected to independent sample t-test to determine significant differences between samples at the 0.05 significance level.

