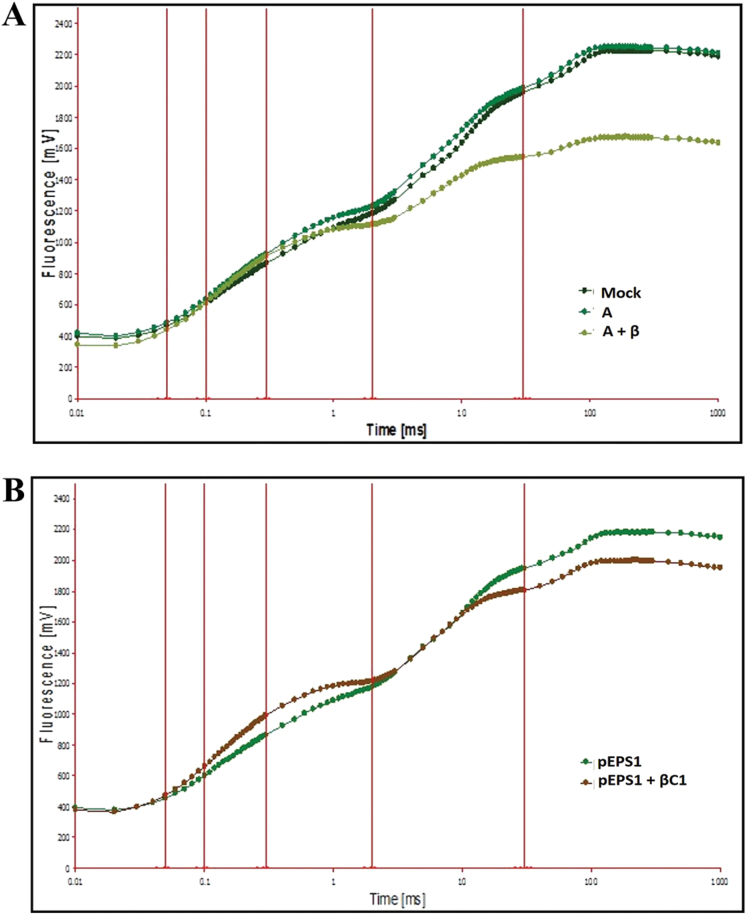
Fig. 6.
Chlorophyll a fluorescence induction curve of infected symptomatic leaves from N. benthamiana. Chlorophyll a fluorescence induction curve of dark-adapted plants infected with (A) mock, A, and A+β at 28 dpi and of plants agroinfiltrated with (B) pEPS1 and pEPS1-βC1 at 7 dpi. The arrowhead indicates the formation of a K peak in the OJIP curve. (This figure is available in colour at JXB online.)

