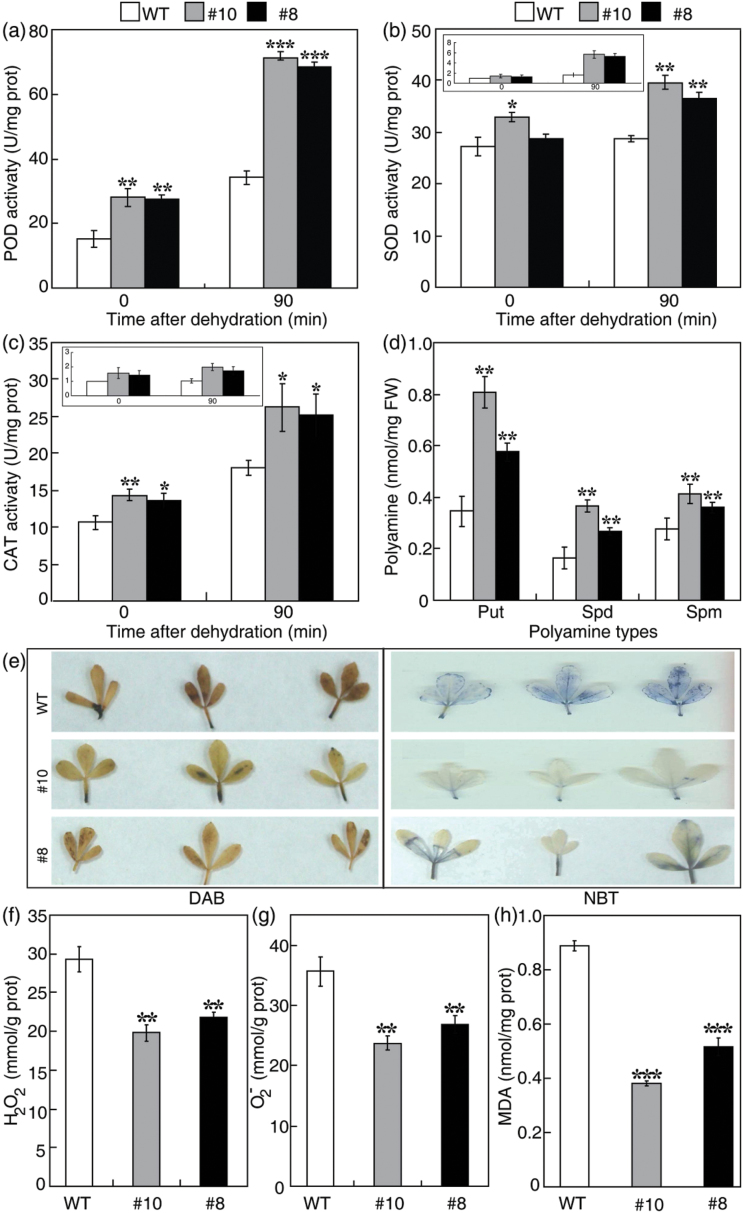
Fig. 8.
The transgenic lines exhibited higher antioxidant enzyme activity and polyamine levels, but lower levels of ROS and MDA. (a–c) Activities of POD (a), SOD (b), and CAT (c) in the wild type (WT) and transgenic lines (#8, #10) before and after dehydration treatment. Error bars indicate the SD (n=3). The insets in b and c indicate transcript levels of SOD and CAT genes before and after dehydration treatment. (d) Free polyamine contents in the WT and transgenic lines under normal growth conditions. Error bars indicate the SD (n=3). (e) Accumulation of H2O2 (left panels) and O2 – (right panels) in the WT and transgenic lines after dehydration treatment, as revealed by histochemical staining with DAB and NBT, respectively. (f–h) Quantitative measurement of H2O2 (f), O2 – (g), and MDA (h) in the WT and transgenic lines after dehydration. Asterisks indicate significant differences between the transgenic lines and the WT at the same time point (*P<0.05, **P<0.01, ***P<0.001).

