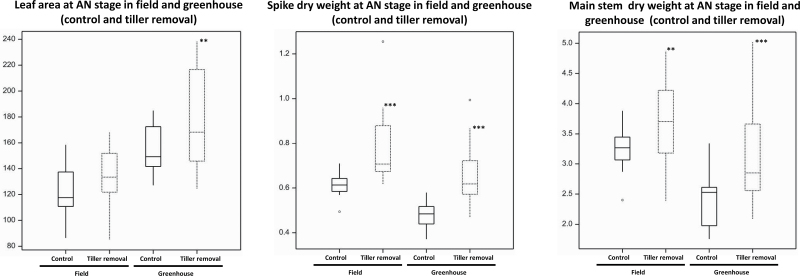
Fig. 8.
Boxplots of leaf area (cm2) (main shoot), spike dry weight (g) (main shoot), and main stem dry weight (g) at AN stage and significant levels of difference between control and tiller removal. **P < 0.01; ***P < 0.001. Each boxplot displays the average of the 12 genotypes for corresponding traits at AN stage; the significances suggest the comprehensive influence of detillering on different traits of the 12 genotypes.

