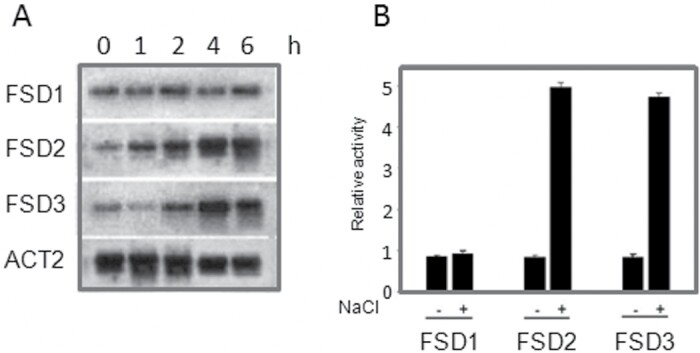
Fig. 1.
FSD1, FSD2, and FSD3 expression following NaCl treatment. (A) Northern blot analysis of FSD1, FSD2, and FSD3 expression. Arabidopsis tissues from different points of the time course were used for RNA gel blot analysis. Total RNA was extracted from wild-type plants without stress treatment (control) or subjected to 150mM NaCl, and incubated for different times. The actin gene ACT2 was used as a loading control. (B) Relative GUS activity, driven by the FSD1, FSD2, or FSD3 promoters, showed the response to NaCl. The FSD1, FSD2, and FSD3 promoters were fused to GUS and tested for their response to NaCl in a protoplast transient expression assay. All experiments were repeated at least three times with similar results.

