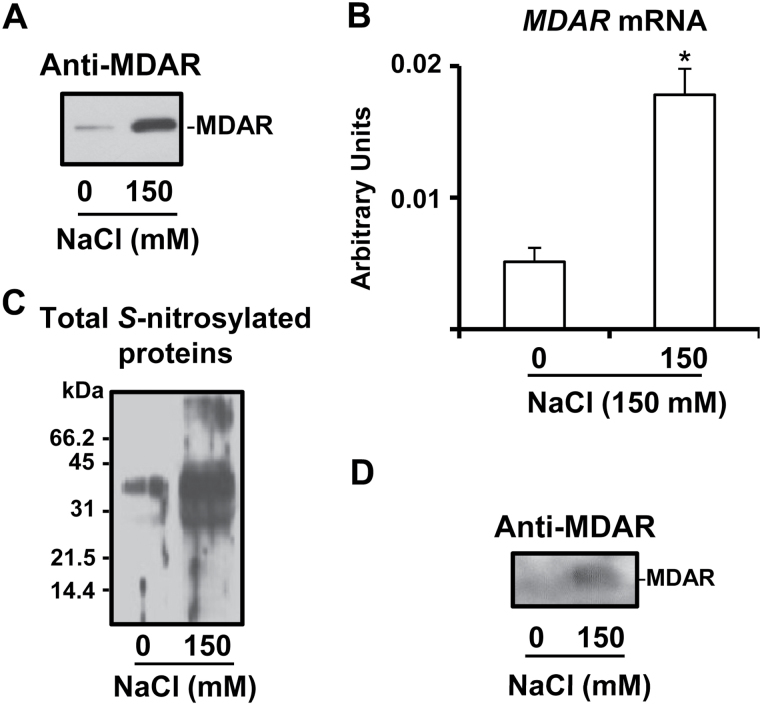
Fig. 5.
Protein and gene expression of MDAR and analysis of S-nitrosylated MDAR in leaves of pea plants under salinity (150mM NaCl) stress conditions. (A) Immunoblotting analysis of MDAR protein expression using an antibody against cucumber MDAR (dilution 1:3000). A 10 μg aliquot of protein was used per lane. (B) Real-time quantitative RT–PCR transcript analysis (arbitrary units) of the MDAR gene. Data are means ±SEM of at least four independent RNA samples. *Differences from control values were significant at P>0.05. (C) Detection of total S-nitrosylated proteins separated under non-reducing conditions by 12% SDS–PAGE and blotted onto a PVDF membrane. Biotinylated proteins were detected using anti-biotin antibodies as described in the Materials and methods. (D) Immunoblot of total S-nitrosylated proteins probed with an antibody against cucumber MDAR (dilution 1:3000). A 5 μg aliquot of protein was used per lane.

