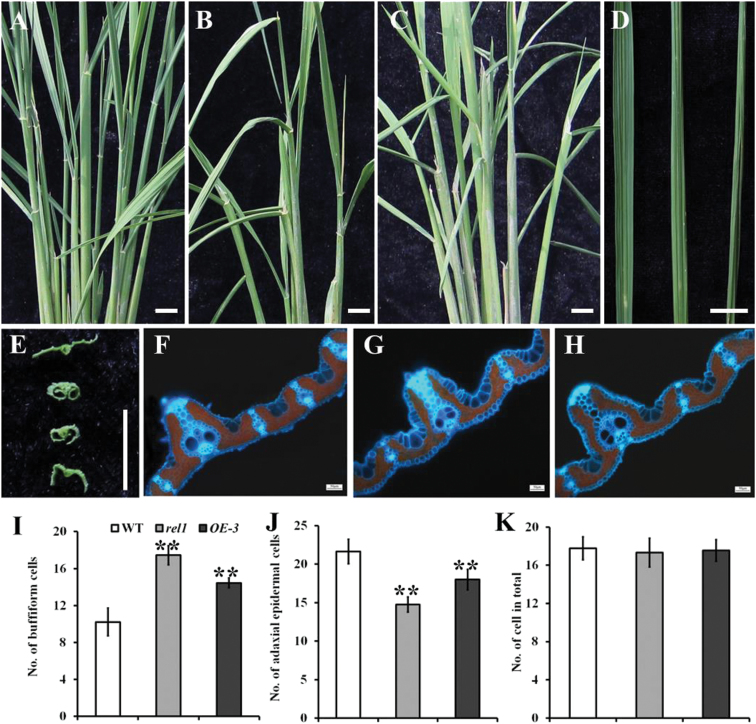
Fig. 5.
Overexpressing REL1 results in a rel1-like phenotype. (A–C) Leaf morphology of wild type (A), rel1 mutant (B), and the REL1 overexpressing plant (OE-3, C) at tiller stage. Two-month-old plants are shown. (D) Leaf phenotype of wild type (left), rel1 (middle), and OE-3 (right). (E) Rolled leaf phenotype of wild type, rel1, OE-3, and OE-4 from top to bottom. (F–H) The cell structure of leaves in wild type (F), rel1 (G), and OE-3 (H). One-month-old leaves were used in this experiment. (I–K) Statistical analysis of bulliform cell number (I), bulliform cell size (J), and parenchyma cell number (K) in wild type, rel1, and OE-3. More than 10 samples were investigated, and the significances are indicated by the asterisks with P < 0.05 (I and J). Bar = 10cm (A to E).

