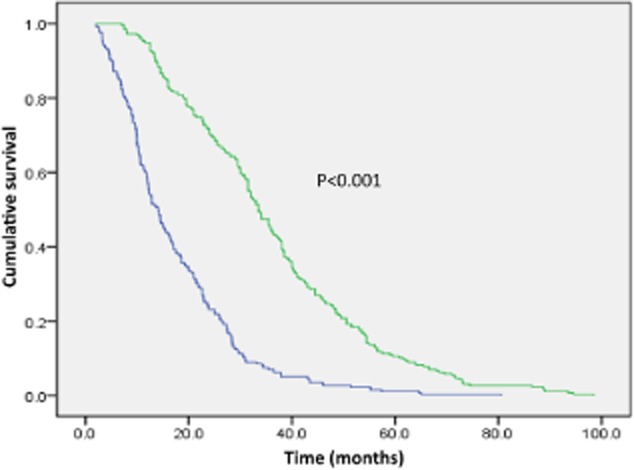
Figure 1.

Kaplan–Meier survival curves for overall survival OS comparison between the simple chemotherapy and gefitinib groups.  , Simple chemotherapy group;
  , Gefitinib group.

Kaplan–Meier survival curves for overall survival OS comparison between the simple chemotherapy and gefitinib groups.  , Simple chemotherapy group;
  , Gefitinib group.