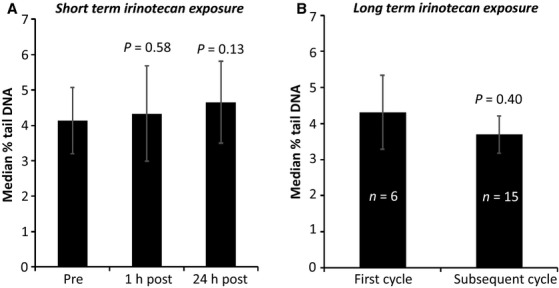
Figure 3.

In vivo study results. Bar graphs illustrating the cumulative results of the DNA damage measured in PBLs isolated (A) before and shortly after irinotecan treatment and (B) prior to receiving the first or subsequent cycles of irinotecan chemotherapy. Results are an average of the median percentage tail DNA across 21 assessable patients’ samples. P values were calculated using the independent samples t-test compared to baseline.
