
Figure 2.
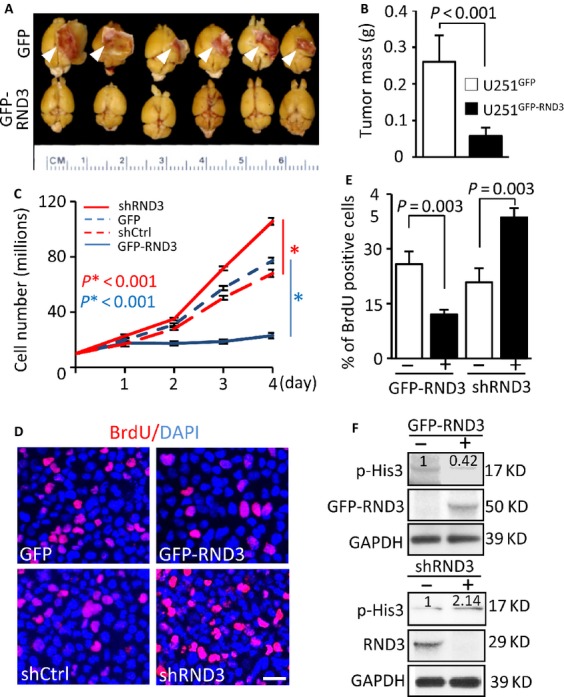
Forced expression of RND3 inhibited glioblastoma cell proliferation and glioblastoma multiform (GBM) growth in mice. (A and B) GBM growth was significantly hindered in nude mice with intracranial implantation of GFP-RND3 cells, a human glioblastoma cell line U251 with GFP-RND3 stable expression, compared to the control mice with intracranial implantation of U251 cells expressing GFP (n = 9 in each group). (C–F) Two U251 cell lines, GFP-RND3 stable expression cell line and RND3 knockdown cell line by shRND3, were synchronized to assess the cell growth rate. In the GFP-RND3 stable expression line, a retarded growth rate (C, solid blue line) was observed with fewer BrdU-stained cells (D and E) and lower p-His3 levels (F, top panel). The number at the top of each band represents the average of densitometries from three experiments, normalized by GAPDH. An opposite result was detected in RND3 knockdown cells. The data of each time point in panel C represent the average of three measurements. In panel E, BrdU-positive cells were quantified from nine images taken from three slides. Data represent means ± SE. Scale bar represents 25 μm. GFP-RND3 molecular weight is around 50 kD, while the endogenous RND3 molecular weight is about 29 kD. P-values were from Student's t-test (B) and one-way ANOVA test (C and E).