
Figure 2.
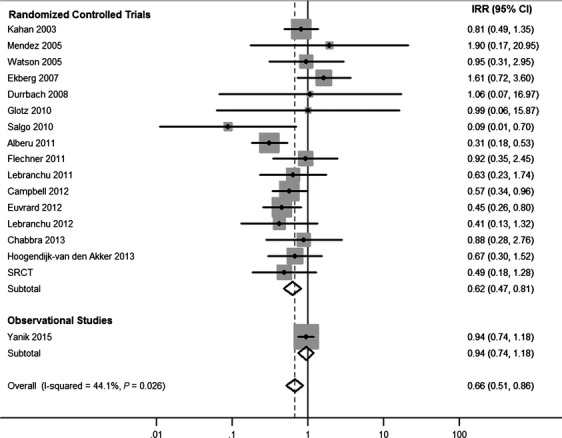
Associations of sirolimus use with overall cancer incidence, estimated in individual studies and overall. Points represent incidence rate ratio estimates for each study, whereas lines represent 95% confidence intervals. The areas of the shaded gray boxes are proportional to the inverse of the variance. Diamonds represent random effects summary estimates for randomized controlled trials, observational studies, and overall. The centers of the diamonds represent the point estimate, and the left and right points of the diamonds extend to the 95% confidence interval values. SRCT, small randomized controlled trial.