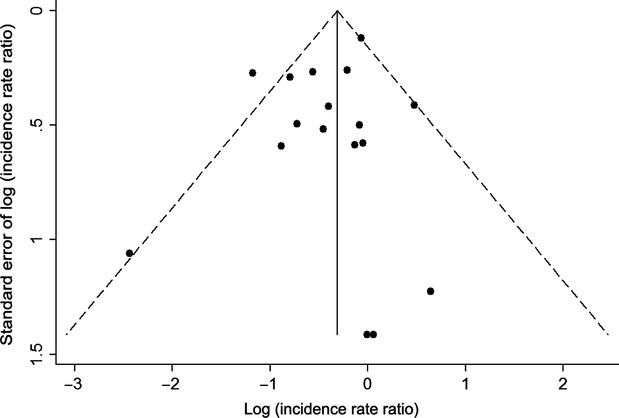
Figure 3.

Funnel plot of included studies. Points represent the 20 randomized controlled trials and Yanik et al. observational study included in the meta-analysis. Points are plotted based on the log(incidence rate ratio) and the standard error of the log(incidence rate ratio) for the estimate of the association between sirolimus use and total cancer incidence. The solid vertical line represents the summary estimate of the log(incidence rate ratio) based on all included studies. The dashed diagonal lines represent the 95% confidence interval estimates for the summary log(incidence rate ratio) at different values of the standard error.
