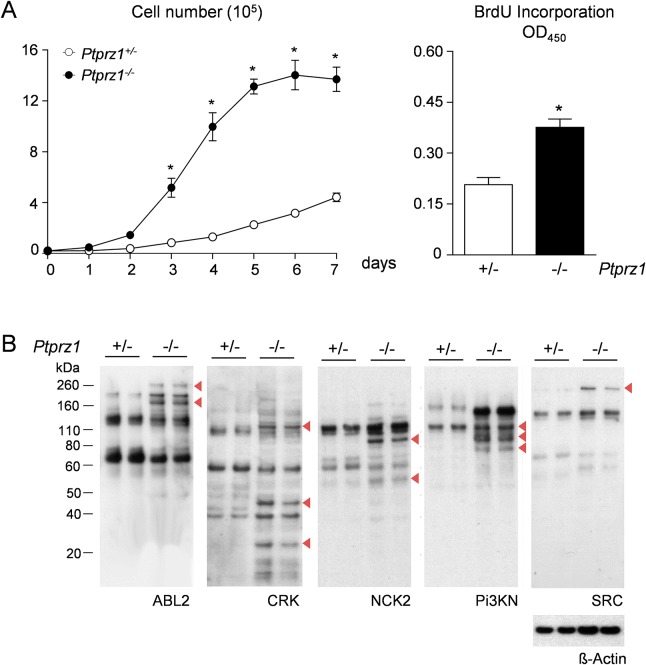
Fig 5. Proliferation and tyrosine phosphorylation in OS cell lines.
(A) Proliferative capacity of tumor cells derived from Trp53-heterozygous mice with either one Ptprz1 allele (+/-) or with Ptprz1-deficiency (-/-). The growth curves (left) and the BrdU incorporation assays (right) demonstrate increased proliferation in the cases of Ptprz1-deficiency. Bars represent mean ± SD (n≥3). Asterisks indicate significant differences between the two genotypes (p<0.05, two-way ANOVA followed by Bonferroni’s post-test (left panel) or two-tailed Student’s t-test (right panel)). (B) SH2 profiling with different SH2 domains reveals differences in tyrosine phosphorylation of specific proteins (indicated by arrowheads). Re-probing of stripped membranes with anti ß-actin mAb served as control for equal loading. Analyses were performed in duplicate with cell extracts harvested at different cell densities.

