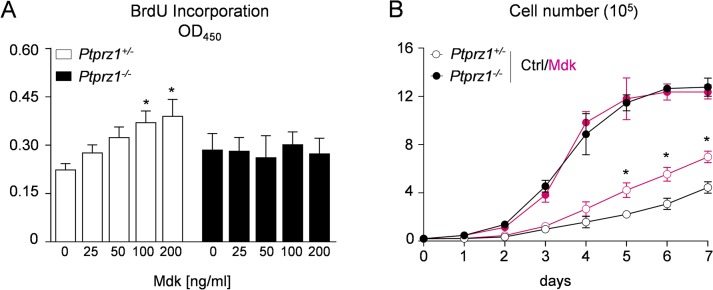
Fig 6. Effects of Mdk on proliferation of OS cell lines.

(A) BrdU incorporation assays with the indicated OS cell lines performed in the presence of Mdk at different concentrations. Bars represent mean ± SD (n = 8). Asterisks indicate significant differences towards controls without Mdk (p<0.05, one-way ANOVA followed by Dunnett’s post-test). (B) Growth curves of OS cell lines in the presence or absence of Mdk (100 ng/ml). Asterisks indicate significant differences towards controls of Ptprz1 +/- cells without Mdk (p<0.05, two-way ANOVA followed by Bonferroni’s post-test).
