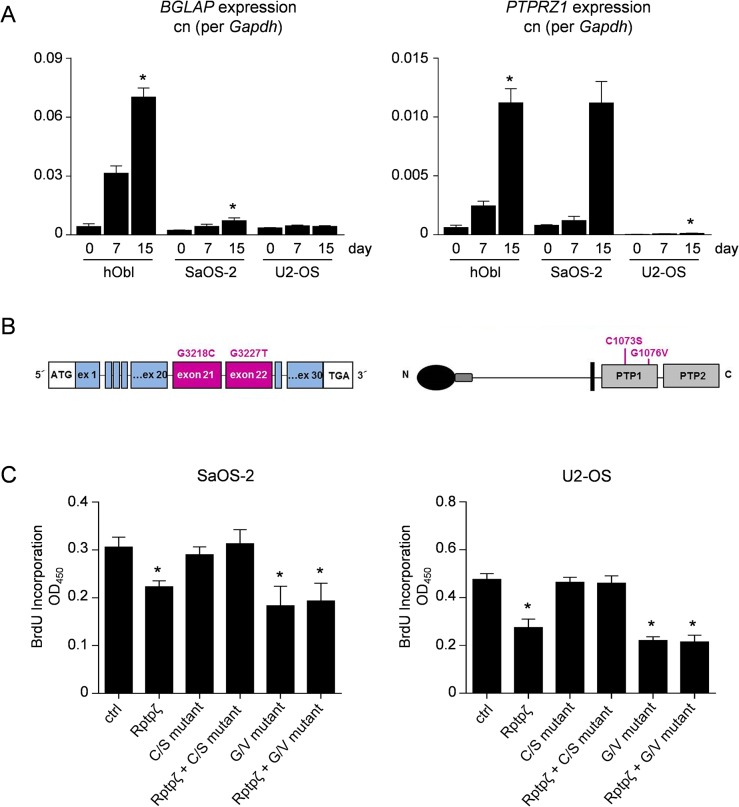
Fig 7. Functional analysis of Rptpζ mutations.
(A) qRT-PCR monitoring expression of BGLAP (left) and PTPRZ1 (right) in human primary osteoblasts (hObl), SaOS-2 or U2-OS cells at different stages of differentiation. Values represent copy number (cn) relative to GAPDH. Bars represent mean ± SD (n = 3). Asterisks indicate statistical significance vs. day 0 (p<0.05, Kruskal-Wallis followed by Dunn’s post-test). (B) Schematic presentation of the PTPRZ1 gene and Rptpζ protein showing the location of the two mutations that have been introduced into a Rptpζ expression plasmid. (C) BrdU incorporation assay with SaOS-2 and U2-OS cells after transfection of wildtype and/or mutant Rptpζ expression plasmids as indicated. Bars represent mean ± SD (n = 6). Asterisks indicate significant differences towards cells transfected with empty vector (ctrl) (p<0.05, one-way ANOVA followed by Dunnett’s post-test).

