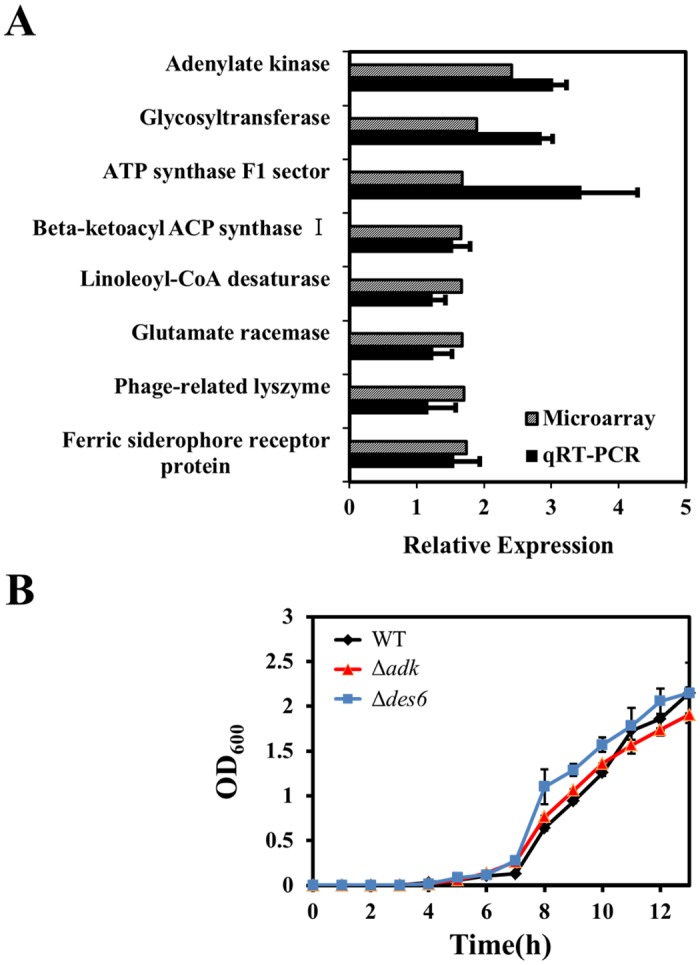
Fig 2. Genes upregulated in Acinetobacter baumannii ATCC17978 after treatment with oleanolic acid, and growth curves for mutants constructed on the basis of the microarray data.

(A) RNA was extracted from Acinetobacter baumannii ATCC17978 cells grown to the exponential phase in Luria Broth after treatment with 64 μg/ml oleanolic acid for 30 min. The relative expression levels of eight genes as assessed by quantitative reverse transcriptase PCR (qRT-PCR; black bars) were consistent with the corresponding microarray data (gray bars). (B) Growth curves of wild-type Acinetobacter baumannii ATCC17978 and mutant strains for 13 h. Based on the results of the microarray data, we constructed Δadk (red triangles) and Δdes6 (blue squares) mutants; WT, wild-type strain; Δadk, adk deletion strain; Δdes6, des6 deletion strain. Data is represented as the average of three replicates.
